

| How To Avoid Nearsightedness
|
The significant problems we have cannot be solved at the same level of thinking we were at when we created them. - Albert Einstein
The earlier chapters point to the need for a more complete model of the normal eye's behavior. In this chapter we will bring all the system components together.
The normal eye needs an accurate lens control system. The existence of optical dead-band, or depth-of-field, causes a non-linearity in the operation of an automatically focused camera. The lens muscles display a noise signal which produces a back-and-forth motion in the lens across the optical dead-band. The computer developed in this chapter predicts the eye's focal status as a function of depth-of-focus, perturbations in the muscles, and the eye's environment.
The focal status of the lens is controlled by blur, as long as the retina can sense blur. When the eye is in darkness, the lens is driven to a neurological "standby", or tonic accommodation position. This conceptual model yields focal status predictions for tonic accommodation as a function of time and the individual's visual environment.
A camera or eye can be limited in resolution by diffraction effects caused by a small aperture, or by granularity effects due to the response characteristics of the film or retina. Less than an aperture of about 2 mm, the normal human eye's resolution is limited by diffraction effects.
In daylight, the human eye has a resolution of about 1 to 2 minutes of arc. In darkness, the human eye can resolve stars that are separated by between 3 to 5 minutes of arc.
Because of granularity effects of the retina, we can change the focal power of the eye's lens without changing the sharpness of the image formed on the retina. This range of focal status values is called the depth-of-focus. Specific values are calculated by the following equation: (Encyclopedia Britannica, Optics, 1970)
FG = Depth-of-focus I = focal length
d = Blur circle a = aperture diameter
The depth of focus is inversely proportional to the diameter of the aperture. With an aperture of 8 mm, the human eye has a depth-of-focus of +/- .15 diopters. In sunlight the iris will have an aperture of approximately 2 mm, which gives us a calculated value for depth-of-focus of +/- .6 diopters.
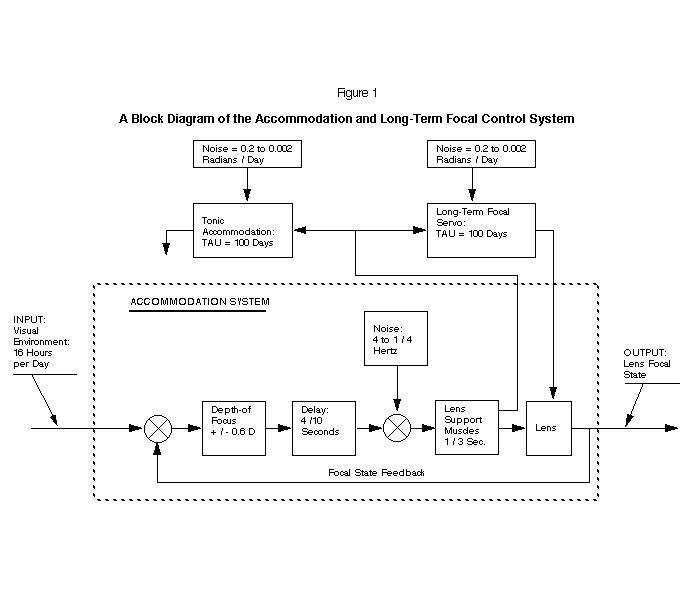
The accommodation system is shown within the dotted lines in Figures 1 and 2. Figure 2 shows the analog computer for accommodation.
The light rays that pass through the lens ultimately produce blur on the retina. The blur is sensed; this then generates a neurological signal which changes the focal status of the lens. The lens is the summing point for the input signal versus the feedback signal. This is the essential definition of a servo-control system.
The visual environment is simulated by making one volt equal to one diopter. The accommodation system is implemented by using four operational amplifiers.
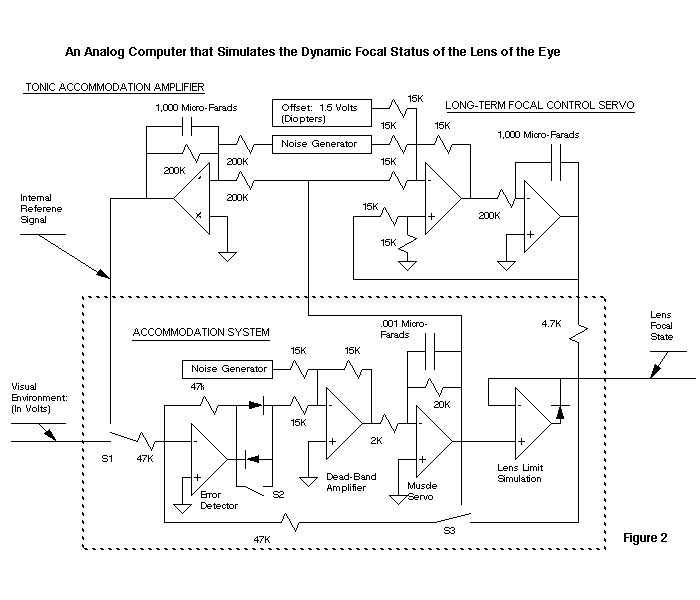
A silicon diode has a knee of 0.6 volts. By using two back-to-back diodes in conjunction with an operational amplifier, we can simulate the effect of dead-band in a servo system. With this simulation there will be no output from the amplifier until the input exceeds +/- .6 volts.
Previous studies have shown that the plant (lens support muscles and ligaments) has a 1/(TAU s + 1) transfer function. We are using an operational amplifier with a gain of ten, and a time-constant of 1/3 second to simulate the muscle-ligament dynamics.
There are numerous sources of noise in a mechanical servo system. The development of these random perturbations are due to thermal effects, noise in the amplifier, and back-lash in the gears. This mechanical system produces a signal which is continually perturbated about the desired, or command signal. This is called control system jitter.
The output position of a noisy servo system can be described by a statistical distribution in terms of frequency spectrum, mean, and root-mean-square values. Systems are normally designed to minimize the effect of noise. Paradoxically, a designer can intentionally use the existing noise in a system to produce a scanning motion in the lens and thereby minimize the effect of dead-band on the output of a control system.
Noise will always exist in a physiological control system, and the output position of these systems can be measured as random perturbations around the mean of the command signal. If the input visual environment is constant, the output signal will be exclusively due to the effects of measurement errors and internal noise in the system.
Dr. A. Suzumura has determined that the noise in the muscles has a characteristic frequency spectrum of from 1/4 to 4 hertz. (1) The output of the analog computer shows a noise signature which is close to the dynamic noise characteristics of the human eye.
Blur control can only occur as noise drives the lens beyond the threshold of the optical dead-band. A recording of the eye's focal status is shown in Figure 3. The eye's focal status never rests and must be described by a statistical-distribution, with the skirts extending beyond the edge of the optical dead-band, as show on Figure 4.
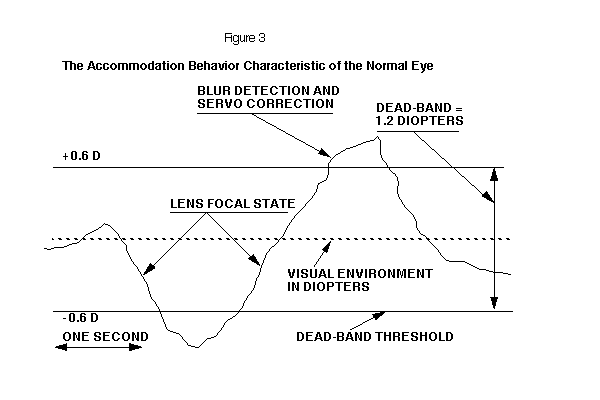
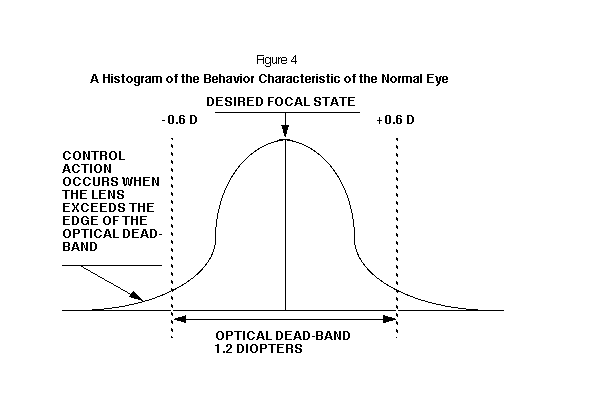
The focal status of the lens is equal to the diopter value of the environment. The standard deviation of this distribution will be perhaps +/- 0.6 diopters. Recent measurements, made by Dr. R. Yamaji using an infrared optometer, have shown servo noise response characteristics of the human eye which are similar to the voltage output of the analog computer. (2)
Based on Dr. Francis Young's experimental data, we show a block diagram that obtains its control from the accommodation signal. (3) Since the stop-to-stop lens travel is ultimately limited by the optical state of the eye, the block diagram shows the long-term system controlling the physical stop position of the lens of the eye, as shown in Figure 1.
The limiting effect caused by the eye's optical state (or length) can be simulated in the analog computer by using an operational amplifier with a diode in the feedback path, as shown in Figure 2. As long as the lens voltage is above the reference value (linear region), the output will be a replica of the input. When the input exceeds the reference value, the output will remain clamped at the reference voltage, thus simulating the measurement of the optical length of the eye.
When the eye is in darkness, the retina is unable to sense blur. The eye (accommodation system) will then select an alternate source for the reference signal. Under tonic accommodation control the lens is not part of the feedback loop. The status of the tonic control can be determined by measuring the focal status of the eye with an infrared optometer. A block diagram of the tonic accommodation control system is shown in Figure 5.
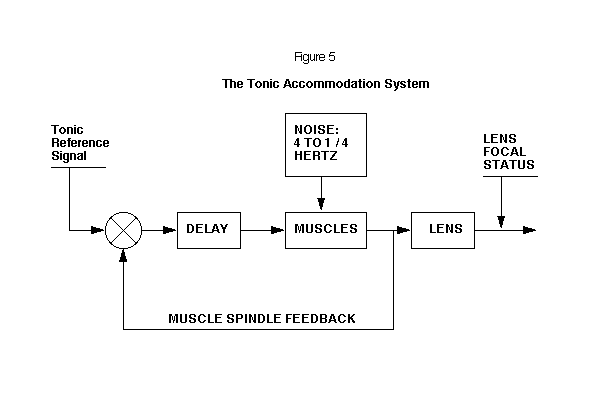
This model for the normal eye's focal status was constructed on the principle of using the smallest number of physiologically justifiable elements that still give a reasonably precise fit to the experimental data (as the data concerns the normal eye's behavior). The model presented is probably the simplest model that can be built that can accurately describe the behavior of the tonic and long-term focal control characteristics of the eye.
1. Suzumura, A., "ACCOMMODATION IN MYOPIA", Proceedings of the Second International Conference on Myopia, Prefecture Hall, Yokohama, Japan, pp. 55-67, May 1980
2. Yamaji, R., "TREATMENT OF ACQUIRED MYOPIA (PSEUDOMYOPIA)", ibid., pp. 91-100
3. Young, F., "THE EFFECT OF RESTRICTED VISUAL SPACE ON THE PRIMATE EYE", American Journal of Ophthalmology, Vol. 52, Part II, Nov. 1961